
In a Nutshell:
Industrial output stays uneven: China prints 6.3% YoY while Europe slips to -1.2%. Manufacturing Sentiments remain expansionary (US 52.3, EU 51.6) but are increasingly flattered by delivery delays and war-linked logistics frictions. Revenue signals confirm a bifurcation: high-growth Asian MV suppliers keep investing, while Western players hover in low single digits.
Implication: machine vision demand persists, but projects skew toward fast-payback productivity and resilience.
Followers of our social media profiles and members of our VisionCrunch community, are already familiar with the economic indicators we use to monitor the manufacturing industry by country. If you are not, please check out this explanation of Manufacturing PMI and year-over-year change in Industrial Output.
Purchasing Managers’ Index™ and PMI® are either trademarks or registered trademarks of S&P Global Inc or licensed to S&P Global Inc and/or its affiliates.
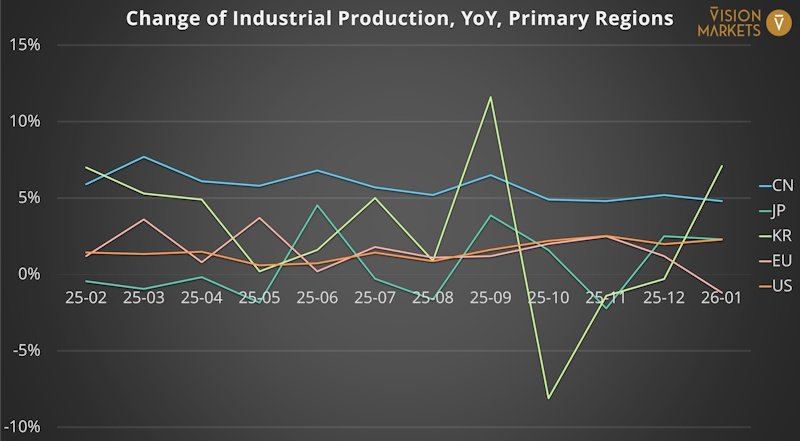
Regional Trends in Industrial Output
Industrial production (YoY) over the latest three data points shows a clear pecking order. China accelerates from 5.2% to 6.3%, the US stays positive but cools to 1.4%, and the EU rolls back into contraction (-1.2%). Japan improves to +2.3% after a negative print, while South Korea swings from +7.1% to -2.2% – textbook semiconductor cyclicality. For automation budgets, this points to Asia-led capacity investment and Europe-led productivity retrofits.
Find always the latest charts on economic indicators on this blog post.
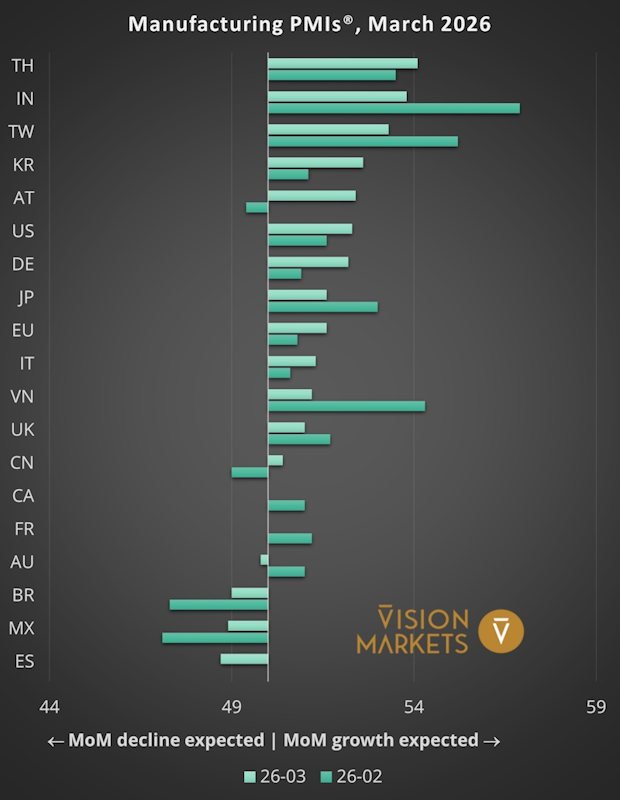
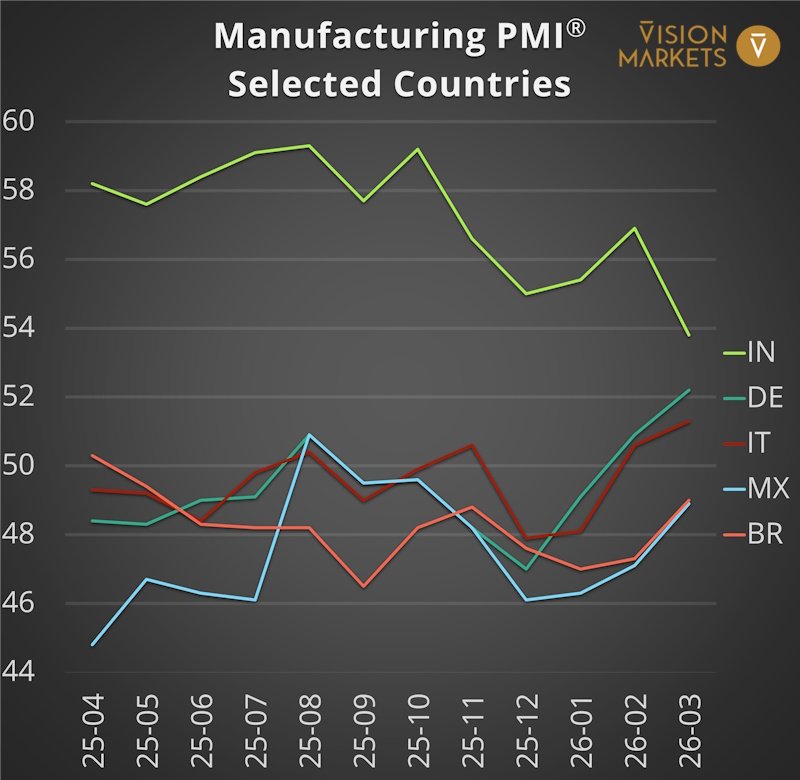
Sentiments in the Global Manufacturing Sector
The J.P.Morgan Global Manufacturing PMI eased to 51.3 in March (from 51.8), still the second-highest reading since June 2022, but the composition matters: output and new orders slowed, input price inflation hit a 44‑month high and business confidence fell to a five‑month low. Factories are still running – yet CFOs are increasingly pricing in ‘unknown unknowns’. That combination delays big-ticket capex while keeping productivity and resilience projects alive.
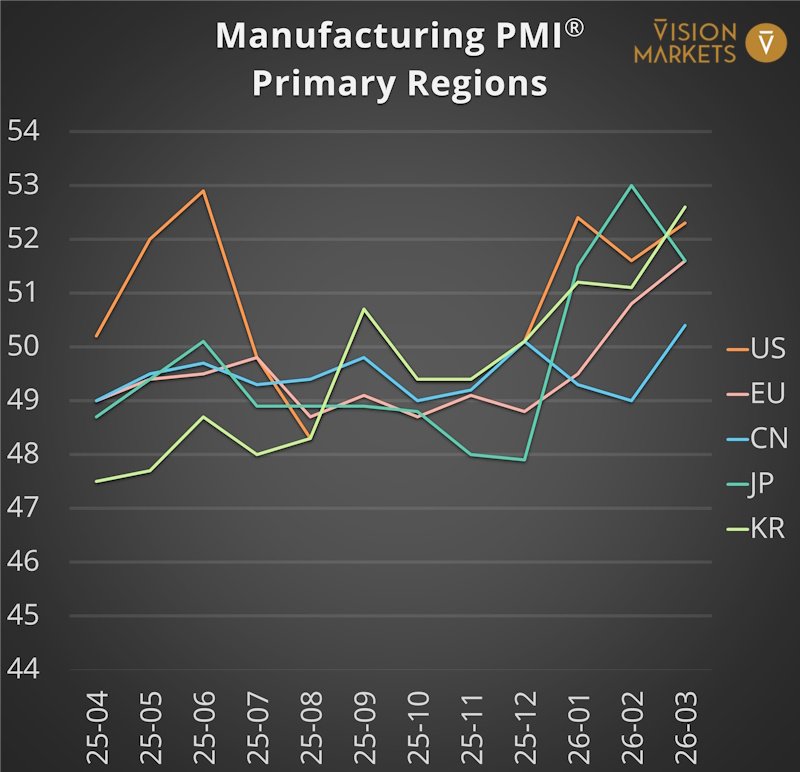
The United States PMI rose to 52.3 in March (51.6 in February). Domestic demand did the heavy lifting while tariffs and shipping challenges continued to hurt exports. Some of the demand uplift was linked to safety‑stock building amid the Middle East conflict shock, and supplier delivery performance deteriorated to the greatest degree since October 2022. Firms noted planned uplifts to capital expenditure and R&D – constructive – but hiring ‘almost stalled’ as managers hedge against persistent price pressure and delivery delays. For machine vision, this is the ‘do the retrofit, defer the cathedral’ phase: brownfield upgrades continue; greenfield plans get more committee meetings.
Eurozone manufacturing is back above water with a PMI of 51.6 in March (50.8 in February), a 45‑month high. The survey highlights the greatest lengthening of input lead times in just over three‑and‑a‑half years as the Middle East war disrupted logistics, while input price inflation soared to a 41‑month high. Purchasing activity rose for the first time since June 2022 and backlogs increased for the first time in almost four years – both typically pro‑investment signals. However, Spain slipped into contraction, employment fell at an accelerated rate, and war-driven inflation is being passed through to final prices, eroding competitiveness. Europe is improving – but on a moving walkway that occasionally runs backwards.
Remark: Why supplier delivery delays can lift PMI readings
PMI is a diffusion index. Longer supplier delivery times are historically associated with stronger demand and therefore enter the PMI calculation inverted.
In the current cycle, longer lead times can also reflect supply-side disruption (component shortages e.g., DRAM; maritime disruption; geopolitics). In that case, delivery delays can lift the headline PMI even while constraining output. We therefore triangulate PMI with new orders, output and industrial production.
China’s manufacturing PMI remains in expansion territory, but the pace of improvement continues to moderate. The latest press release highlights that while overall conditions are still improving, momentum has softened as rising input costs notably higher energy and oil prices weigh on manufacturers’ margins. New orders and output are still expanding, yet less forcefully than earlier in the year, and purchasing managers report increased cost pressure rather than demand-led acceleration. For automation and machine vision, China remains a growth market, but the signal has shifted from broad-based capacity expansion toward more selective investments focused on efficiency, yield improvement and cost containment.
Japan’s M-PMI cooled from 53.0 in February to 51.6 in March. Output and new orders still expanded, with investment goods the strongest segment and semiconductors/AI cited as demand pockets – yet input costs rose at the strongest rate in 19 months and the outlook softened.
South Korea’s M-PMI improved to 52.6 in March (51.1 in February), the best pace in just over four years. Output rose at the steepest rate in 19 months, with new products and semiconductors named as drivers. Input price inflation was the fastest since June 2022 and output charges increased at the strongest rate since July 2022 – a reminder that the same factors boosting orders can also squeeze margins.
India’s HSBC M-PMI fell to 53.9 in March from 56.9 (weakest level in close to four years) as cost inflation hit a 43‑month high and firms absorbed costs to defend customer relationships.
ASEAN’s M-PMI cooled to 51.8 from a record 53.8 as new orders and output slowed and export orders declined, while price pressures spiked.
Translation for automation: Investment in automation equipment continues, but projects get sliced into smaller, faster-payback chunks – good for modular vision rollouts.
What we’ll watch next month:
A key swing factor will be whether a longer cease fire in Iran and a broader calming of the conflict translate into measurably easing energy-driven input costs and confidence. This month’s PMI commentary is unusually explicit about war-related logistics disruption and price pressure; if these pressures cool, the gap between headline PMI prints and underlying fundamentals should narrow – and investment committees may become less allergic to greenfield spending.
Revenue Trends of Key Players
Disclaimer: For information purposes only. No investment advice!
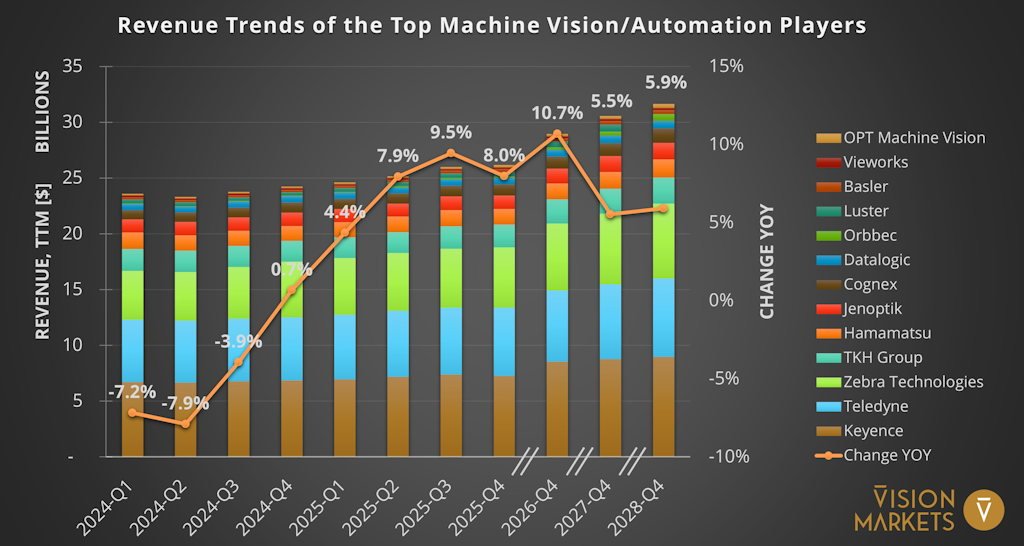
At the aggregate level, our basked of suppliers with a significant Machine Vision business shows an annual TTM growth of 8.0% in 2025‑Q4, rising to a 10.7% consensus growth rate for 2026 solid, but still “growth-with-a-spreadsheet” rather than “boom-with-a-party”, especially considering the devaluation of the US Dollar against the Euro by ~4.5% in 2025 and by 5.1% against the JPY in 2026 so far.
Winners (full-year 2026 consensus): growth is again led by Orbbec (CN) 75.1%, Luster (CN) 25.2%, and heavyweight Keyence (JP) 17.6%. The pattern remains striking: China‑headquartered players are at the top of the scale, while their forward estimates have historically been more ambitious than those of mature Western peers sometimes rightly so, sometimes merely optimistic.
Latest fully available quarter (2025‑Q4): the top growth rates were Orbbec (CN) 69.0%, OPT Machine Vision (CN) 41.1%, and Luster (CN) 32.5%.
Laggards (full-year 2026‑Q4 consensus): Hamamatsu (JP) 4.4%, Teledyne (US) 4.4%, and TKH Group (NL) 4.8% sit in the low single digits.
Heavyweights in focus:
2026 guidance implies Vision Technologies again outgrowing the group, helped by consolidating 2D brands under Allied Vision and focusing 3D under LMI to win larger logistics, tire, EV‑battery and defence situational‑awareness projects; this makes machine vision the key growth engine while Automated Machinery and soft European capex keep overall growth closer to mid‑single digits.
2026 outlook calls for modest group growth but outsized momentum in Digital Imaging, where FLIR infrared, thermal OEM and space‑sensor wins should deliver high‑teens growth and buffer softer test and industrial lines, making imaging the primary structural driver rather than a headwind.
Consensus 2026 acceleration rests on warehouse and manufacturing automation, where machine‑vision‑enabled scan tunnels, AI quality inspection and RFID visibility platforms are expected to grow double‑digit and outpace slower mobile computing, so Imaging and Vision act as catalysts for mix improvement, not constraints.
2026 guidance implies Vision Technologies again outgrowing the group, helped by consolidating 2D brands under Allied Vision and focusing 3D under LMI to win larger logistics, tire, EV‑battery and defence situational‑awareness projects; this makes machine vision the key growth engine while Automated Machinery and soft European capex keep overall growth closer to mid‑single digits.
Implications for Machine Vision players:
Plan for a market that is still growing, but with sharper ‘where’ and ‘why’. If you want a quick sanity-check of your 2026 pipeline against these region-by-region signals or an outside view on which applications justify investment under higher cost volatility – reach out. Vision Markets supports clients with market intelligence, strategy, and M&A in the global machine vision ecosystem.