
Economic Indicators by Target Regions of Machine Vision Suppliers
Vision Markets is following its mission to make the global Machine Vision industry thrive. By one means, we support our clients with market reports and forecasts on the global market for machine vision components and solutions.
Most Machine Vision companies target the industrial production market. Therefore, the economic indicators of the manufacturing activity in different regions are crucial for predicting the trends of the machine vision market. Our research team tracks over 120 different indicators and polls the market insights from a network of more than 600 deciders globally.
About our Market Indicators and Regional Segmentation
On this page we share some of the relevant trailing and leading indicators parameterizing the global manufacturing activity. Such secondary indicators allow for estimations of the current and future investments in manufacturing facilities and production automation equipment, such as machine vision components and solutions.
- Lagging indicator: Change of Manufacturing Output in percent year-over-year (YoY) by country
- Leading indicator: Sentiment index of purchasing managers in manufacturing, also known as Manufacturing PMI (M-PMI).
We divide the global market for machine vision products into five regions: North America, EMEA, China, Japan & Korea, and Rest of World (RoW). Each of these regions (except for RoW) contributed between 1 and 2 billion USD to the global sales revenues of machine vision components in 2023 according to our machine vision market report. This segmentation reflects the regional differences and maintains a reasonable balance among the geographies.
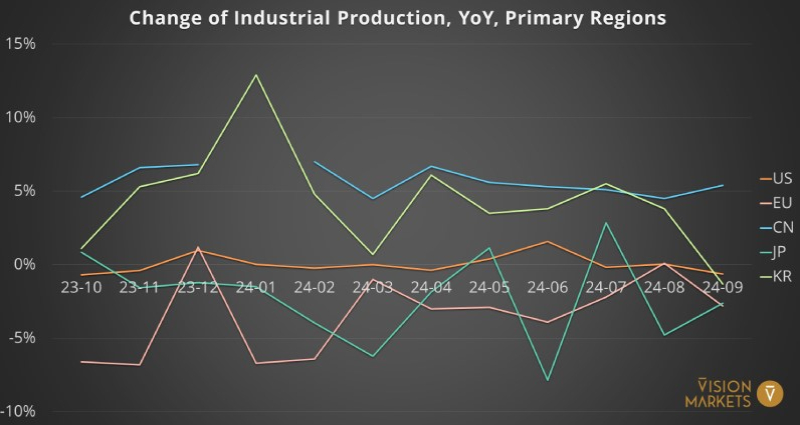
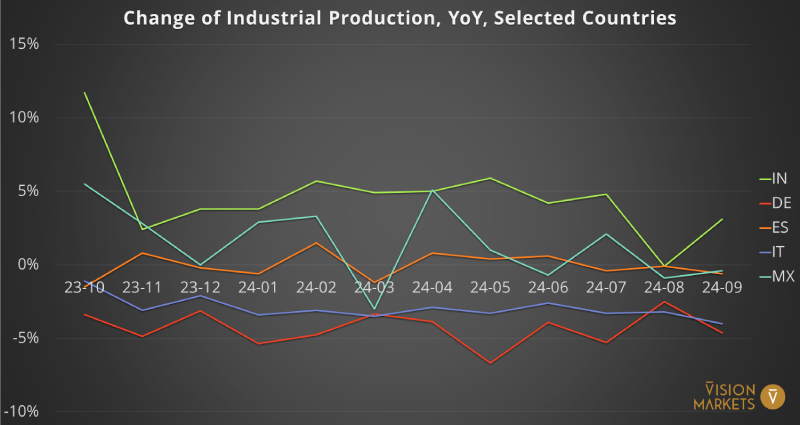
Change of Industrial Production Year-over-Year (YoY)
An increased industrial production output in a certain region typically demands a mid- to long-term expansion of the manufacturing capacity. Hence, a growing industrial manufacturing out indicates a growing need for manufacturing automation equipment.
Yet, even in phases of flat or declining manufacturing activity, numerous factors can still drive the demand for manufacturing automation equipment such as machine vision components. Those regional factors can include:
- High labor cost
- Lack of skilled workers
- New regulations on quality, traceability, or yield
For better readability, we separate the charts into primary target regions of machine vision and selected countries. The charts show the indicator readings for the last 24 months. If you would like to obtain data sets back to 2018 please contact us.
Manufacturing PMIs
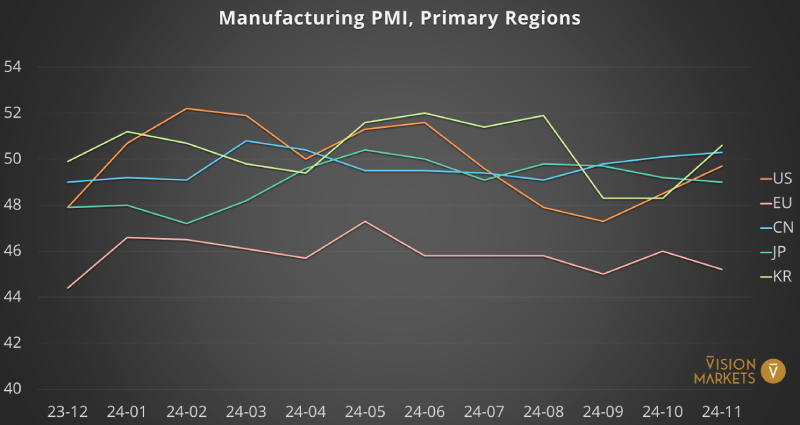
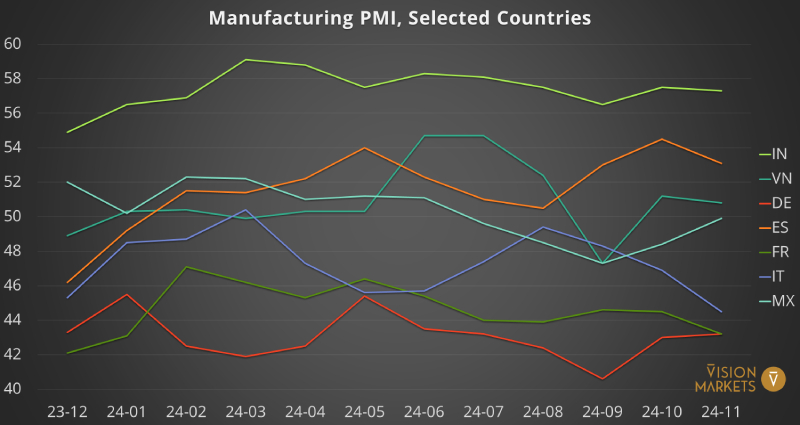
The Manufacturing PMI (Purchasing Managers’ Index) is based on a monthly survey conducted among manufacturing company managers. It gathers information on new orders, production, employment, supplier delivery times, and stock levels. The survey asks similar questions across different countries and regions, enabling valid global comparisons. Responses are compiled into an overall score ranging from 0 to 100. A reading above 50 indicates expansion in the sector, below 50 indicates decline.
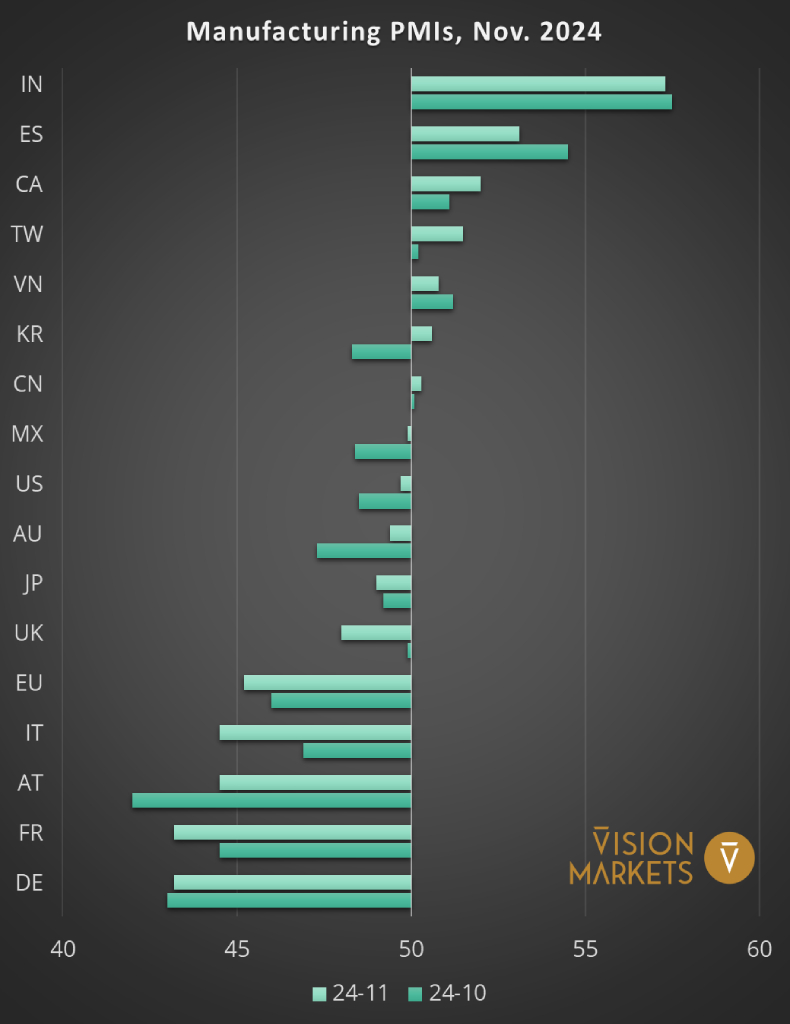
To allow for some retrospective, we also offer the Manufacturing PMI readings of the last 24 months. Again, for better readability, we separate the charts into primary target regions of machine vision and selected countries. The charts show the indicator readings for the last 24 months. If you would like to obtain data sets for previous years, please contact us.
How to Use Manufacturing PMIs for your Machine Vision Business
At Vision Markets, we use the Manufacturing PMI as one of several indicators to forecast the trend of the Machine Vision market in its primary target regions, i.e. Europe, North America, China, Japan and South Korea as well as India and Southeast Asia.
The monthly updates of the Manufacturing PMIs below shall support Machine Vision players to
- Define and adjust your forecast of sales turnover in the industrial automation market per region
- Set the right priorities and adjust the spendings for your marketing campaigns in industrial automation per region
- Focus your direct sales efforts and sales channels on the right regions depending on your business strategy
How to Benefit from our Expertise
Do you want to be notified about all updates on Manufacturing PMIs and other key business news for the Machine Vision market? We invite you to join the VisionCrunch community for the optimal development of your Machine Vision business!
Would you like a detailed analysis of your short- and long-term business potential with different target customer groups and regions? We are happy to define and implement the optimal strategy tailored to your business.
Set yourself up for growth and contact us now!
Don’t miss our future market updates!
Subscribe to our VisionCrunch business newsletter today!
